October 5, 2021
Post questions to the Moodle Forum!
For this lab, you’ll be writing a Python program to analyze a data set. Python is frequently the programming language of choice for performing data analysis in the sciences and other fields, so the skills you practice in the lab are some the most broadly applicable in CS 111. You’ll work with data collected by the MIT Election Data and Science Lab (MEDSL) about elections to the US House of Representatives in 2018.
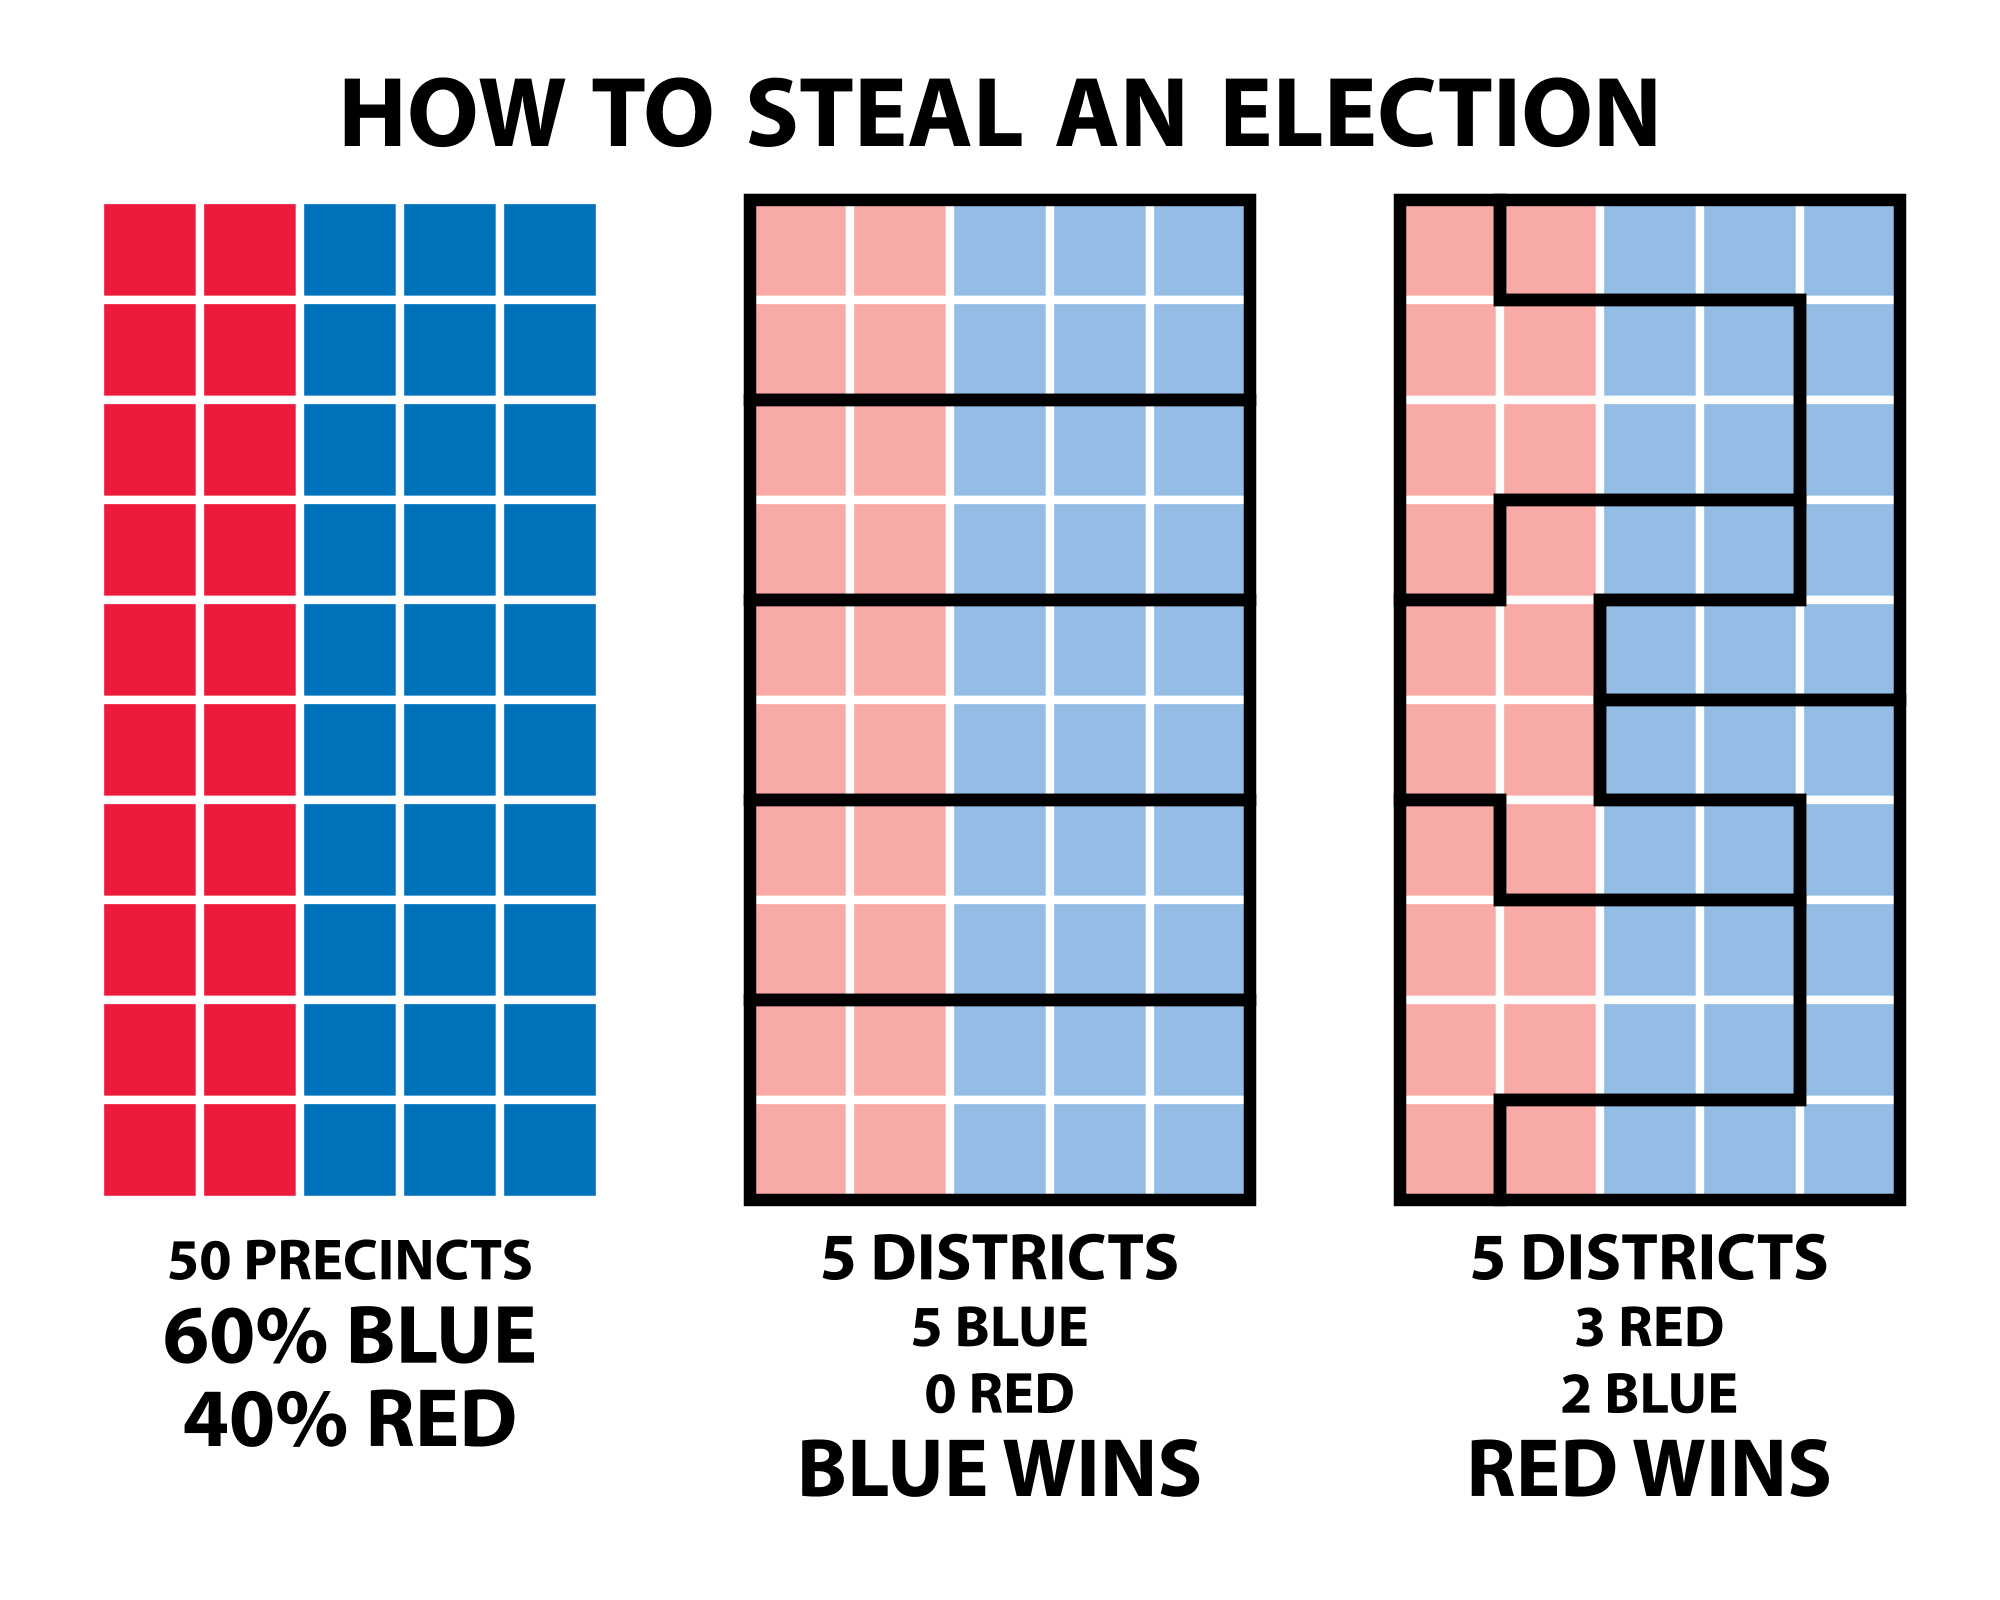
The central question you will analyze is the issue of gerrymandering. This is the idea of drawing electoral boundaries to benefit one political party over another. This short video gives an excellent explanation. For a real-world example, see FiveThirtyEight’s explanation of measuring a partisan gerrymander. You’ll be performing a similar analysis, comparing the each party’s share of the vote received to the share of the seats won in each state in 2020. Numerous lawsuits have been filed across the country in recent years challenging current maps as unconstitutional, and those court battles may have a big impact on the next round of redistricting taking place this year. The purpose of this lab is to
Download the following data file to start the lab:
district_overall_2020.csv: results for elections to the US House of Representatives, which along with the US Senate forms the US Congress. The sections below lay out the steps for your analysis of gerrymandering. Your code will read in the data file, and write output to a file called gerrymandering-report.txt. Your code should not read in any other data, nor declare data besides what is read in from the CSV file (e.g., you should not declare a list of states like states = ["Alabama", "Alaska", ...]—any data like this must be computed from the input files). Start early and post questions to the Moodle forum!
Suggested timeline:
Remember to consult the Testing Advice for tips on how to test your solution.
The first step in any data analysis is to load in your data. In this case, we need to open and read in district_overall_2020.csv, which has information about elections to the House.
Start a new Python script called gerrymandering.py. In it, use the built-in function open to open the data file like this:
data_file = open("district_overall_2020.csv")For this to work, district_overall_2020.csv must be in the same directory as gerrymandering.py.
Now that we’ve opened the file, we can start reading it in. First, though, we need to actually look at the file to see how the data is arranged. Open district_overall_2020.csv (you can do this right in VS Code) and take a look around. You may find it useful to refer documentation from MEDSL about the variables (i.e., columns) in the data. An election is uniquely identified by the combination of state and district (e.g., the first few lines of the file correspond to the Alabama District 1 election, followed by the Alabama District 2 election, and so on). Note the answers to the following questions (not to turn in, just to orient yourself):
The file object returned by the open function has a couple useful methods for reading in our data.
data_file.readline() will return the next line in the file as a string.data_file.readlines() will return a list of all the remaining lines in the file, where each element of the list is a string of one of the lines.As we saw in class, you can also use a for loop to iterate over the lines in a file. Your goal is to have a variable data_lines that stores a list of all the lines in the file, except the very first line. This first line contains the names of the fields in the data file, and including it in data_lines will cause problems when it comes time to do the analysis. You can handle excluding this line as you read in the file or after the fact using the list method pop.
Remember to have your code close the data file after you’ve finished reading it with data_file.close().
At this point, you have the raw data, but it’s not in a very convenient form. If you add print(data_lines[0]) to gerrymandering.py, you’ll see that our data is still in text form rather than divided into columns. Fortunately, Python strings have a split method that will do exactly what you need. Follow the link to the documentation on split and read through the description and examples to see how you can use it to convert a line of input data from raw text into a list where each element is a entry in the data. Write a for loop that replaces each element of data_lines with the corresponding split-up version. You’ll know you’ve succeeded when print(data_lines[-3]) displays
['2020', 'WYOMING', 'WY', '56', '83', '68', 'US HOUSE', '0', 'gen', 'FALSE', 'FALSE', 'UNDER VOTES', '', 'FALSE', 'TOTAL', '6337', '278503', 'FALSE', '20210604', 'FALSE\n']data_lines is now a list of lists where each inner list contains the data from one line of the input file. If we want to access a specific field within a line, we can do so by accessing the inner list element at the appropriate index. For example, the office field (indicating which elected office an election was for) is the seventh “column” in our data file (counting by commas), so data_files[0][6] accesses the office field of the first line in the file.
Writing [6] everywhere to access the office field is bad style, however, since it means we have to remember that [6] means “get the office.” A much better approach would be to define a function for accessing the office field:
def get_office(line):
    return line[6]
This would let us write the far more understandable get_office(data_lines[0]). You will be expected to write a similar function for every field you need to access in your analysis. If that field is numerical (e.g., a number of votes), you should use the int function to covert the text to a number as part of the function. As far as get_office goes, you won’t need that particular function. Since we’re only dealing with data about US House of Representatives elections, the office field is not very interesting for our analysis (it’s "US HOUSE" for every line).
Before you start coding up the analysis itself, there are two lists you should generate that will make your life much easier: a list of all 50 states, and a list of all 435 elections. As mentioned in the Logistics section, you should generate these lists from the data instead of typing them out directly in your code. To generate a list of states, you might try
states = []
for line in data_lines:
    states.append(get_state(line))
This has a problem: every state appears multiple times in the data file, so we end up with a ton of duplicate entries in our list. It’s much more useful to have a list where each state appears only once. To accomplish this, insert an if statement in your loop over the data that checks whether a state has already been added to the list before appending it. Remember that you can use VALUE in LIST to get True if VALUE is present in LIST and False otherwise.
You should also generate a list of elections in a similar fashion. As described above, an election is identified by the combination of the state and district. Write a get_election function that returns the state and district fields concatenated together, and then use a loop to generate a list elections. You can check your work by printing out the length of the states and elections lists, which should be 51 and 436, respectively (as they will include the District of Columbia).
Now everything is in place for your analysis of potential gerrymandering. Specially, you need to compute four results for each state:
Here the two-party vote is counting only the votes for Republicans and Democrats, not including any other parties or write-in votes.
Below is pseudocode (something partway between English and a programming language) for the algorithm you should use to compute these quantities.for each state
initialize variables for GOP and Dem votes and seats
for each election in the current state
generate a list of vote-party tuples from the current election
for each vote-party tuple
add votes to the corresponding party's vote total
determine the winning party
add one to the winning party's seat total
output resultsSome advice on translating this pseudocode to Python:
for loop over elections with an if statement inside to check that election matches the current state. The string method startswith is a good way to check this.for loop over data_lines with an if statement checking if the election matches. Inside the if, append a tuple of the votes and the party from the current line. It’s important that votes be the first element of the tuple.sort on your list of tuples. It will sort the list in ascending order (smallest to largest) according to the first element of each tuple. This will conveniently place the tuple with the largest number of votes at the end of the list, which we can access at index -1.if-elif to determine which party’s variables to add votes or seats to (the two parties are "REPUBLICAN" and "DEMOCRAT")See the next section for details on output.
print, you will write it to a file. The output for each state should be in the following format
STATE NAME
Republican: REPUB_VOTE_PERCENTAGE% of the vote, REPUB_SEAT_PERCENTAGE% of the seats
Democrat: DEM_VOTE_PERCENTAGE% of the vote, DEM_SEAT_PERCENTAGE% of the seats
BLANK LINE
All percentages should be rounded to two decimal places (use the built-in round function).
ALABAMA
Republican: 69.93% of the vote, 85.71% of the seats
Democrat: 30.07% of the vote, 14.29% of the seats

ALASKA
Republican: 54.58% of the vote, 100.0% of the seats
Democrat: 45.42% of the vote, 0.0% of the seats
At the top of the file where you open the data file, add the following line to open the output file in write mode.
output_file = open("gerrymandering-report.txt", "w")This will create a new, blank file called gerrymandering-report.txt, overwriting any file with that name that already exists. Remember to close the output file at the end of your program.
To write your output to this file, you’ll use its write method (i.e., output_file.write("...")). write differs from print in two important ways:
write does not insert a new line with each call the way print does, so you will need to handle new lines yourself. In Python the new line character is written "\n".print can take multiple arguments and combines them in the output with spaces in between, write will only take a single argument. You can use + to concatenate multiple strings together, so you might use Python output_file.write(state + "\n") to write a line to the output file with the name of a state. This concatenation will only work between strings, so you’ll have to use the str function to convert any numbers into strings.Here’s an example of print and write calls that produce the same output (one to the screen and the other to a file). Note how you need to put in spaces between words yourself when using write:
outfile = open("rep_count.txt", "w")
state = "Minnesota"
count = 8
print(state, "has", count, "representatives")
outfile.write(state + " has " + str(count) + " representatives\n")Data analysis is just number crunching without some kind of human interpretation or action based on the results. Now that you’ve written code to crunch the numbers, it’s time to interpret! The redistricting after the 2010 census has been challenged in court in a number of different states. The analysis you perform in this lab is far from the only way to measure gerrymandering, but it can still help illuminate what’s going on. If you haven’t already, please review this Youtube video and FiveThirtyEight article on gerrymandering.
Your task is to interpret the results of your analysis for three states: Maryland, Michigan, and Wisconsin. The question you are to consider is whether your analysis supports claims of gerrymandering in those states. In comments at the top of gerrymandering.py, write two paragraphs answering this question. Your answer should include both numerical results from your analysis as well as comparisons between those three states and others. If your answer is that your results don’t clearly support any conclusion about the presence of gerrymandering, that’s perfectly fine—just make sure to support your argument. I’m not looking for an in-depth essay here, just a demonstration that you’ve taken the important step in data analysis of engaging with the issue you are analyzing.
You will be expected to write code the produces an output file in exactly the format described above. To help you check this as well as check your numerical results, you can use this sample output file: sample-gerrymandering-report.txt. VS Code provides a very useful way of comparing two files. Use the method described in that link to bring up your output file and the sample output file side-by-side, and make sure there are no differences (differences will show up highlighted green or red in VS Code).
Play around with any or all of these challenges if you find yourself with extra time. Put all code for these in challenges.py (including copying any or all of your code from gerrymandering.py).
The analysis you’ve done so far has a critical flaw—it gets the wrong results for Minnesota! It is not the case that Minnesota Republicans won 100% of the vote in 2020. Track down what’s causing this incorrect result, and implement a fixed version of your gerrymandering analysis in challenges.py.
In most US elections1, the candidate with the most votes on Election Day wins. How much or how little a candidate wins by (i.e., the difference between the winning vote total and the second place vote total), however, can influence how the result is interpreted and how the winner behaves in office. For example, a Representative who won by the slimmest of margins might be more politically cautious than one who won in a landslide2.
Add code to challenges.py to find the closest and most lopsided contested House races of 2020 (measured in number of votes between first and second place). For each one, it should write a line to a file called challenges.txt describing the seat (i.e., state and district as in Washington District 3) and the margin of victory.
In addition for voting for candidates on the ballot, voters can instead cast votes for candidates (or anyone, really) that don’t appear on the ballot. These are called write-in votes, as the require the voter to literally write in the name of the person they want to vote for. Very rarely a write-in candidate can even win, as was the case for Alaska Senator Lisa Murkowski’s reelection in 2010, but more often a write-in vote is intended as satire or protest (see the 120 write-in votes for Donald Duck in the 2010 general elections in Sweden).
Add code to challenges.py to find the 2020 House election with the most write-in votes. Your code should write a line to challenges.txt with both the election and the number of write-in votes.
Submit the following files via the Lab 3 Moodle page. You do not need to submit any CSV files.
A file called gerrymandering.py that when run uses the provided data file to create (i.e., open in write mode) a file called gerrymandering-report.txt formatted as described in Output File. Please do not submit your output file. We will run your code to generate the output file as part of the grading.
OPTIONALLY a file called challenges.py containing your code for any CHALLENGES.
This assignment is graded out of 30 points as follows:
gerrymandering.py produces a file called gerrymandering-report.txt – 3 points= and operators (>, or, etc.) – 1 point.py file you submit – 1 pointYour output file will be evaluated by automated script that tests for correct format and results. If you submit code that crashes the autograder (because your code crashes or you used different function names than those specified in this writeup), we will attempt to fix any issues and re-grade. You will lose points for each issue we need to fix.
All other aspects will be evaluated by us reading your code.
exceptions include two-round runoff elections as in Louisiana and the ranked-choice voting recently instituted in Maine↩︎
won in a landslide is a phrase meaning a candidate had a huge margin of victory↩︎