CS 111 f21 — Image Data
1 Polls
2 2D Data
- index multiple times to get to individual elements in a nested list
data[:2]is[[3, 1, 6], [2, 8, 9]]data[:2][-1]is[2, 8, 9]data[:2][-1][::-1]is[9, 8, 2]data[:2][-1][::-1][0]is9
- row-major order
- the inner lists are the rows, not the columns
- don't really behave like a grid with rows and columns
- try to slice a column:
data[:][1](the idea would be all rows, second column, but instead we just get the second row) - a module called
numpyprovides a very useful variation on a list called anarray
- try to slice a column:
3 Image data
- how to represent color?
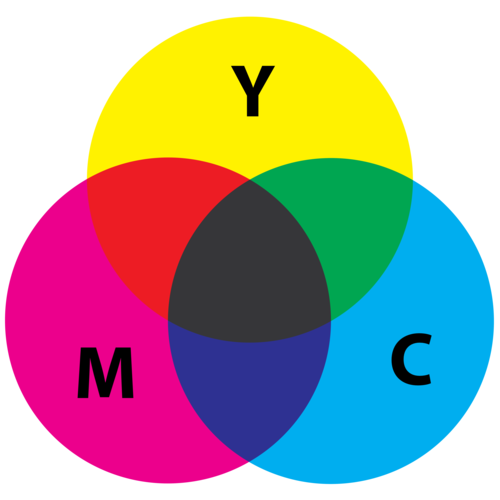
- printing on paper: CMYK (cyan, magenta, yellow, black)
- digital: RGB (red, green, blue)
- on screens, tightly packed red, green, and blue elements light with different intensities
![]()
- many different geometries are possible
![]()
- Samsung Galaxy Note 4
![]()
- Samsung Galaxy Nexus
![]()
- Apple iPhone 5
![]()
- in image files, divided up into grid, each cell is called a pixel, each pixel has a mix of red, green, and blue
- Color picker: https://www.google.com/search?q=color+picker
3.1 Represent an Image in Python (2x2 example)
![]()
3D list!
[[[1.0, 0.0, 0.0], [0.0, 1.0, 0.0]],
 [[0.0, 0.0, 1.0], [1.0, 0.0, 0.0]]]
4 Working With Images
import matplotlib.pyplot as plt
image = plt.imread("owl.png")
- image data as an array
- what you see when you print
[[[0.5019608  0.5411765  0.40784314 1.        ]
  [0.49803922 0.5254902  0.39215687 1.        ]
  [0.5019608  0.5137255  0.37254903 1.        ]
  ...
  [0.3764706  0.3529412  0.34901962 1.        ]
  [0.3647059  0.35686275 0.35686275 1.        ]
  [0.37254903 0.37254903 0.37254903 1.        ]]

 [[0.49803922 0.52156866 0.40784314 1.        ]
  [0.5058824  0.5254902  0.40784314 1.        ]
  [0.5058824  0.5137255  0.39215687 1.        ]
  ...
  [0.3647059  0.32941177 0.3372549  1.        ]
  [0.38039216 0.35686275 0.37254903 1.        ]
  [0.3882353  0.36862746 0.3882353  1.        ]]

 [[0.4862745  0.4862745  0.4117647  1.        ]
  [0.48235294 0.48235294 0.40392157 1.        ]
  [0.49411765 0.5019608  0.41960785 1.        ]
  ...
  [0.3647059  0.30980393 0.3372549  1.        ]
  [0.40392157 0.34509805 0.39607844 1.        ]
  [0.40392157 0.34901962 0.40784314 1.        ]]

 ...

 [[0.3254902  0.32941177 0.26666668 1.        ]
  [0.3019608  0.30588236 0.24705882 1.        ]
  [0.3137255  0.32156864 0.27058825 1.        ]
  ...
  [0.4392157  0.4        0.29803923 1.        ]
  [0.4627451  0.41960785 0.3372549  1.        ]
  [0.44705883 0.40392157 0.32941177 1.        ]]

 [[0.29411766 0.28235295 0.22352941 1.        ]
  [0.3254902  0.31764707 0.26666668 1.        ]
  [0.31764707 0.31764707 0.2784314  1.        ]
  ...
  [0.43137255 0.39607844 0.30980393 1.        ]
  [0.41960785 0.3882353  0.30980393 1.        ]
  [0.40392157 0.37254903 0.29411766 1.        ]]

 [[0.34509805 0.32156864 0.26666668 1.        ]
  [0.33333334 0.31764707 0.27058825 1.        ]
  [0.2901961  0.2901961  0.25490198 1.        ]
  ...
  [0.41960785 0.3882353  0.30980393 1.        ]
  [0.4117647  0.38431373 0.30588236 1.        ]
  [0.40784314 0.38039216 0.3019608  1.        ]]]
- 0 to 1 for each of red, green, and blue
- fourth value is the transparency, or alpha
image.shapegives us a tuple of the dimensions,(702, 1024, 4)- 702 rows, 1024 columns, 4 values per pixel
image.sizegives us the total number of entries in the array- \(702\times1024\times4 = 2875392\)
- len, loops the same
for row in range(len(image)):
  for column in range(len(image[row])):
    rgba_pixel = image[row][column]
- unlike lists, numpy arrays are fixed size, and can hold only one kind of data (i.e., a particular array must be all integers or all strings)
- what you see when you print
- array indexing
- row, column
- can do
image[row, column]instead ofimage[row][column]
- can do
- slicing along multiple dimensions
- slice out the owl's face:
image[200:500, 200:800]
- slice out the owl's face:
- row, column
4.1 Fruit Ninja Redux3
- crop the image by 200 pixels on each side
- slice out 100-by-100 box in bottom right corner
- black out every other column (set all the pixels in every other column to [0.0, 0.0, 0.0, 1.0]
Footnotes:
1
aMOOObc
2
9
3
import matplotlib.pyplot as plt
image = plt.imread("owl.png")
cropped = image[200:image.shape[0] - 200, 200:image.shape[1] - 200]
plt.imshow(cropped)
plt.show()

box = image[image.shape[0] - 100:, image.shape[1] - 100:]
plt.imshow(box)
plt.show()

blacked_out = image.copy()
for row in range(blacked_out.shape[0]):
  for column in range(0, blacked_out.shape[1], 2):
    blacked_out[row, column] = [0.0, 0.0, 0.0, 1.0]
plt.imshow(blacked_out)
plt.show()